
Exploring Earth from Space with EO Browser: Unlocking the Power of Satellite Data
Introduction
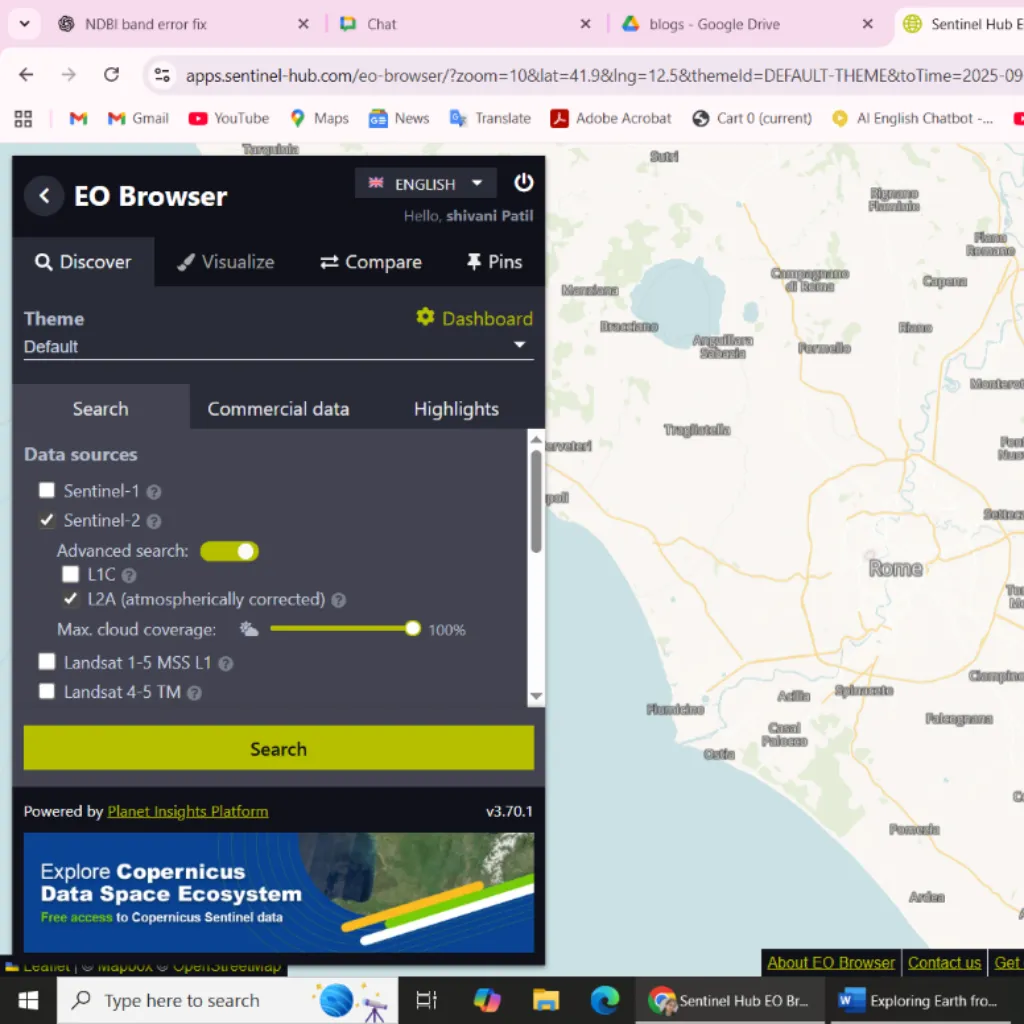
Satellite imagery has become a cornerstone of modern data intelligence-transforming how we monitor cities, forests, oceans and even air quality. From tracking urban expansion to assessing agricultural productivity, remote sensing provides insights impossible to gain from the ground. One of the most impactful tools democratizing access to satellite data is EO Browser, a free online platform developed by the European Space Agency (ESA) and Sinergise under the Copernicus program.
With EO Browser, anyone-from researchers and environmentalists to students and AI developers-can visualize, analyze and download satellite data right from their web browser, no installations required.
What is EO Browser?
EO Browser is a web-based visualization and analysis tool that merges data from multiple Earth observation missions, including Sentinel, Landsat and MODIS.
It enables users to:
- View high-resolution satellite imagery from multiple missions
- Compare changes across years with time-series analysis
- Apply built-in remote sensing indices (NDVI, NDWI, NDBI)
- Export imagery, graphs, or datasets for further AI or GIS analysis
In essence, EO Browser bridges the gap between raw satellite data and actionable insights, empowering data-driven environmental monitoring and AI-based research.
Key Features Of EO Browser
[A] Multiple Satellite Data Integration
EO Browser integrates diverse satellite datasets for comprehensive spatial and temporal analysis:
- Sentinel-2: High-resolution multi spectral imagery for vegetation and land use.
- Landsat series: Historical data archives from the 1980s for long-term trend analysis.
- MODIS: Medium-resolution global datasets for near real-time monitoring.
- Sentinel-5P: Atmospheric measurements-tracking pollutants and greenhouse gases.
This multi-source fusion allows researchers and organizations to analyze both historical patterns and real-time changes with precision.
[B] Time-Lapse and Historical Change Detection
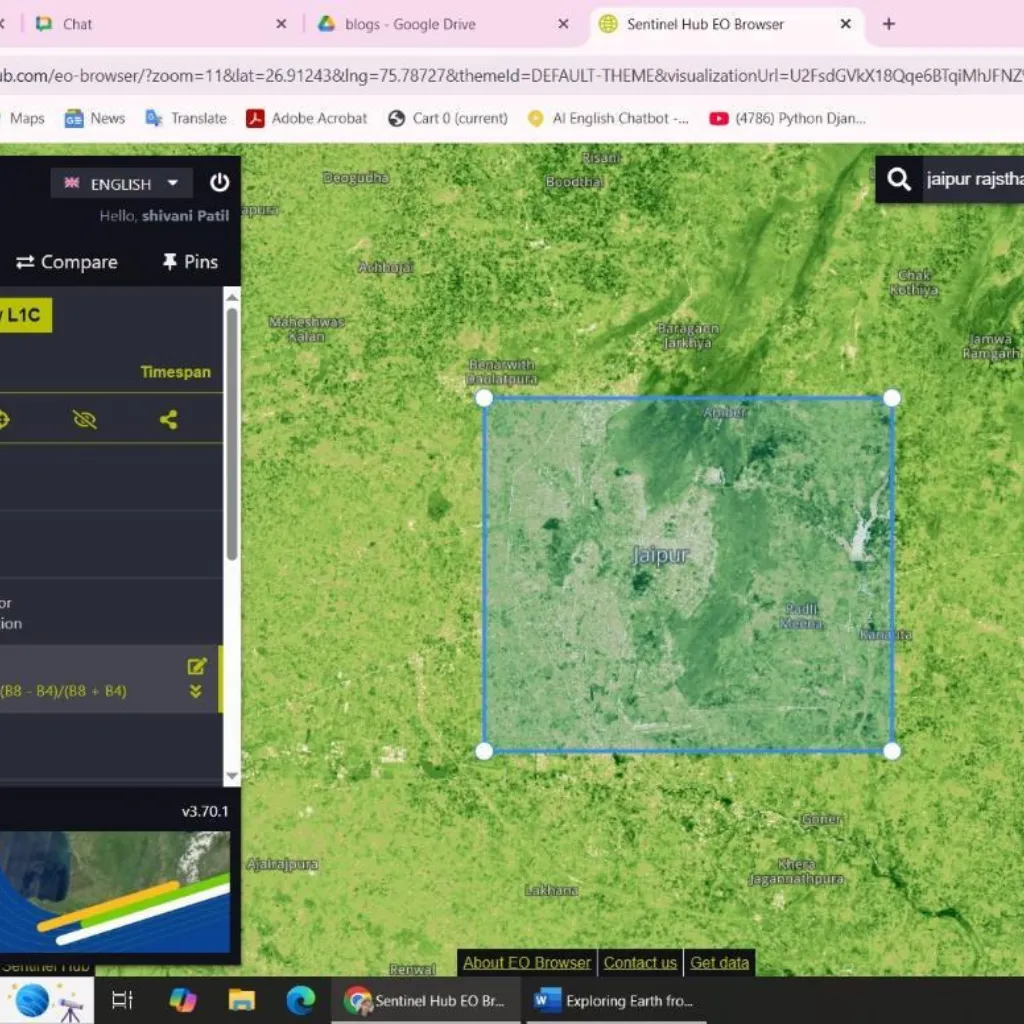
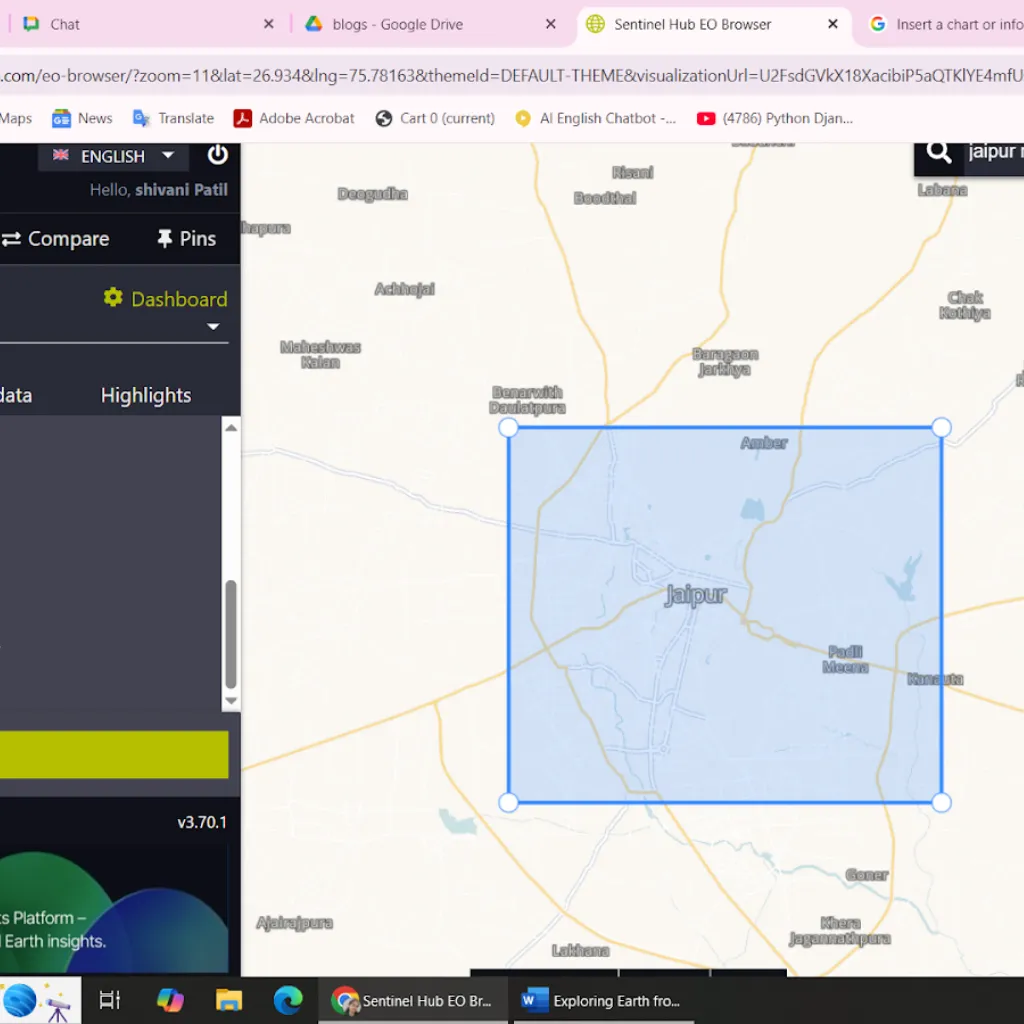
EO Browser’s time-lapse feature visualizes environmental and urban transformation over time.
Examples:
- Monitor urban sprawl in cities like Jaipur or Bengaluru from 2008 to 2025.
- Study seasonal crop variations in agricultural zones.
- Track glacier retreat or forest cover loss due to climate change.
These temporal insights support urban planners, policymakers and environmental scientists in making evidence-based decisions.
[C] Built-In Indices & Analysis Tools
EO Browser includes pre-configured spectral indices to make remote sensing analysis simple and powerful:
- NDVI (Normalized Difference Vegetation Index): Measures vegetation health.
- NDBI (Normalized Difference Built-Up Index): Detects urban development.
- NDWI (Normalized Difference Water Index): Tracks water bodies and flood zones.
- False Color Composites: Highlight vegetation, water and built-up regions using multispectral imaging.
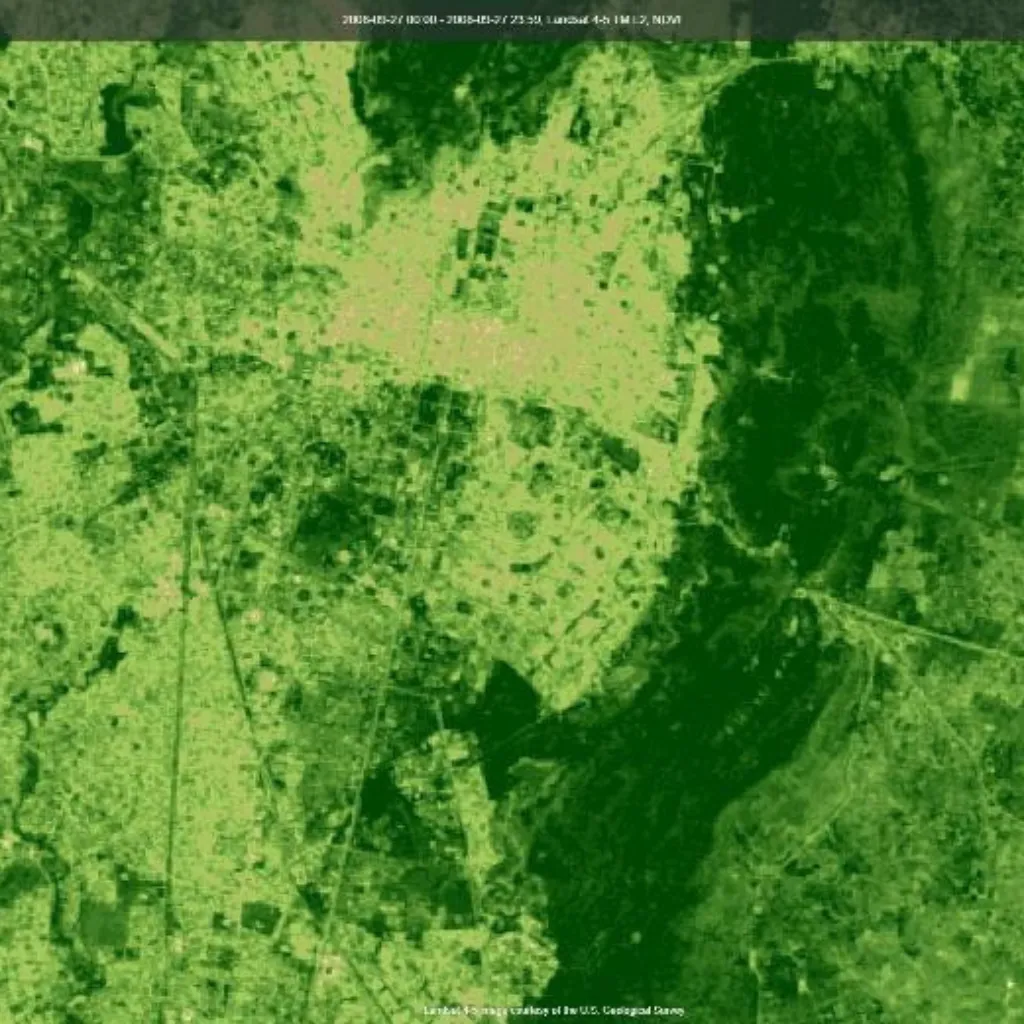
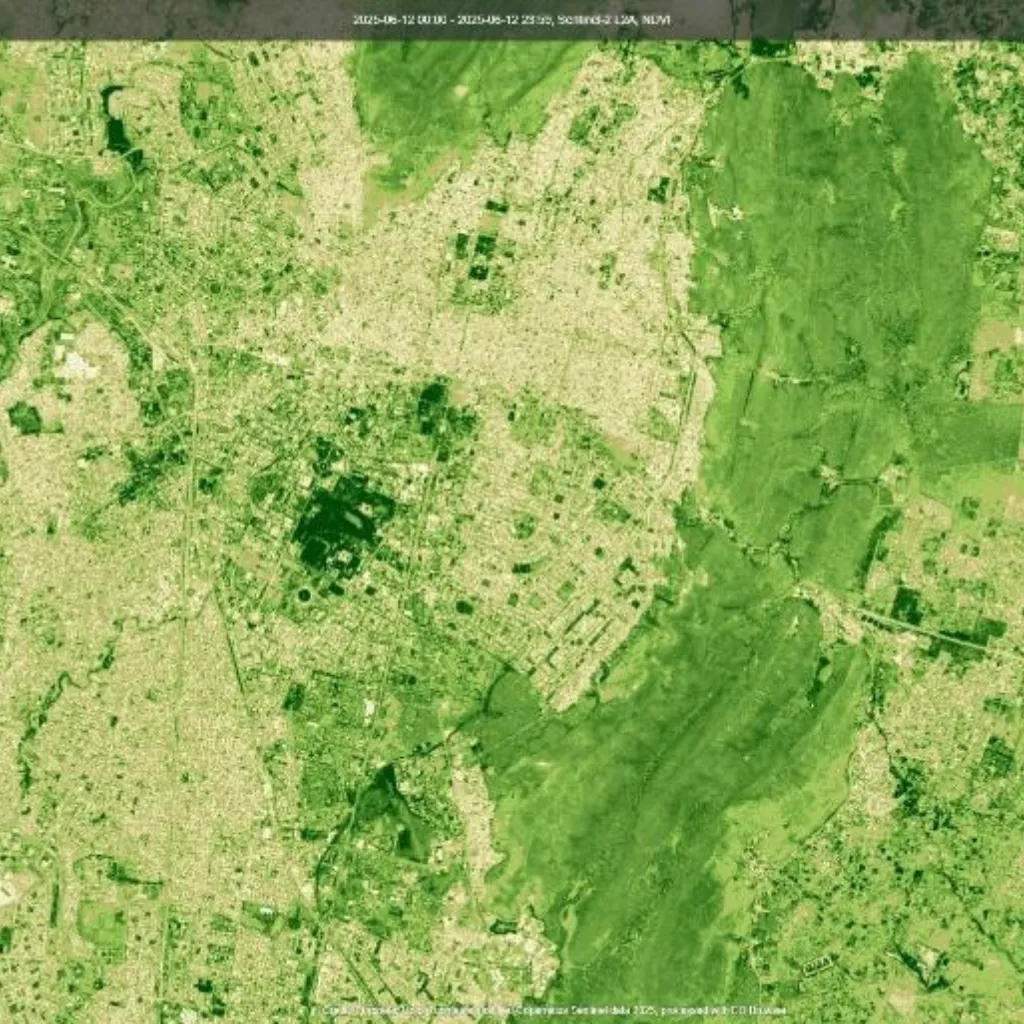
NDVI/NDBI(2025)
NDVI/NDBI(2008)
Example Insight:
Comparing NDVI/NDBI maps from 2008 and 2025 reveals how vegetation cover declined while built-up areas expanded-offering a clear visual of urbanization trends.
[D] Custom Scripting and Data Export
Advanced users and AI developers can enhance EO Browser’s capabilities with:
- Custom JavaScript scripts for personalized data processing.
- Data export options (GeoTIFF, PNG, CSV) for further analysis.
- Integration with AI tools like Google Earth Engine or GIS platforms.
This flexibility makes EO Browser an ideal foundation for AI-driven geospatial analytics, land classification and environmental modeling.
Real-World Applications of EO Browser
EO Browser supports a wide range of applications across industries and research domains:
- Urban Development: Monitor infrastructure growth and land-use change.
- Agriculture: Track crop health, irrigation patterns and yield potential.
- Disaster Management: Map floods, wildfires and drought-affected areas.
- Climate Research: Analyze glacier melt, air quality and forest depletion.
By simplifying access to satellite data, EO Browser empowers AI-driven decision-making and supports sustainable development goals (SDGs) worldwide.
Advantages Of EO Browser
1. Free and open access-no installations or licenses required.
2. Historical and real-time data-monitor environmental change over decades.
3. User-friendly interface —suitable for beginners and professionals alike.
4. Reliable data sources-from ESA, NASA and Copernicus missions.
Limitations To Consider
Despite its strengths, users should note a few practical limitations:
- Cloud cover can obscure satellite visibility in certain regions.
- Spatial resolution varies across satellites-smaller structures may not appear clearly.
- Interpretation accuracy improves with basic knowledge of remote sensing principles.
Conclusion
EO Browser has made Earth observation accessible to everyone. What once required specialized GIS software or paid subscriptions can now be achieved in minutes through a web browser. Whether you’re a researcher, student, or AI professional, EO Browser provides a window into our planet’s evolution-helping us understand how cities grow, forests shrink and climates shift over time.
So next time you wonder how much your region has changed, open EO Browser and explore Earth from space.
Partner With Us
At AI India Innovations, we empower researchers, enterprises and governments to leverage AI and satellite data for environmental monitoring, urban planning and sustainability analytics. From building custom geospatial AI pipelines to integrating Earth observation data with automation platforms, we help organizations unlock real-time planetary intelligence through advanced AI solutions. You can also read more about our work and trends in our other Blogs on our website.
